
TMC – TSim Monte Carlo
The TMC application enables parallel and repeated execution of waveform simulations for a single topology in the TSim application. This allows multiple scenarios to be randomly generated and tested under specific rules. TMC has a separate GUI but it uses the same simulation engine as TSim.
Simulation iterations that reveal desgin errors or those that need to be further investigated from the batch simulations run with TMC can be examined in more detail with TSim. For this purpose, all TMC iterations that are run are automatically saved in the TSim simulation file format.
Capabilities
The TMC application provides the following capabilities:
- A specific simulation parameter can be scanned over a value range and simulation be run multiple times.
For example: Running 40 iterations for each of the values 50, 100, 200, 500, and 1000 units. - The calculation and graphical display of the min, max, average values, and distributions of metrics for all iterations.
- Saving the results to a database and the ability to load previously saved results for tracking.
- Automatically generating a results report in .pdf format.
- Saving each iteration run in a format that can be repeated in TSim.
- Notifiying the user of iterations that result in errors.
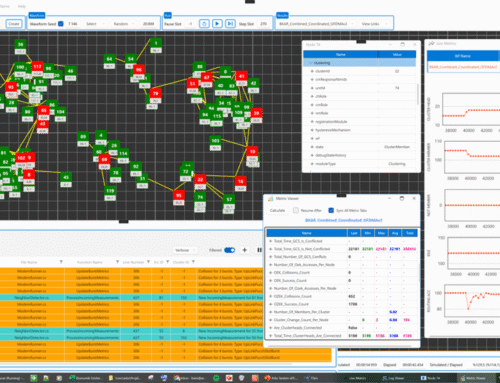
Main Window
On the main screen, users can modify both the simulation parameters and the number of parallel iterations to run simultaneously. The interface allows real-time monitoring of each iteration’s completion status, as well as current RAM and CPU usage.
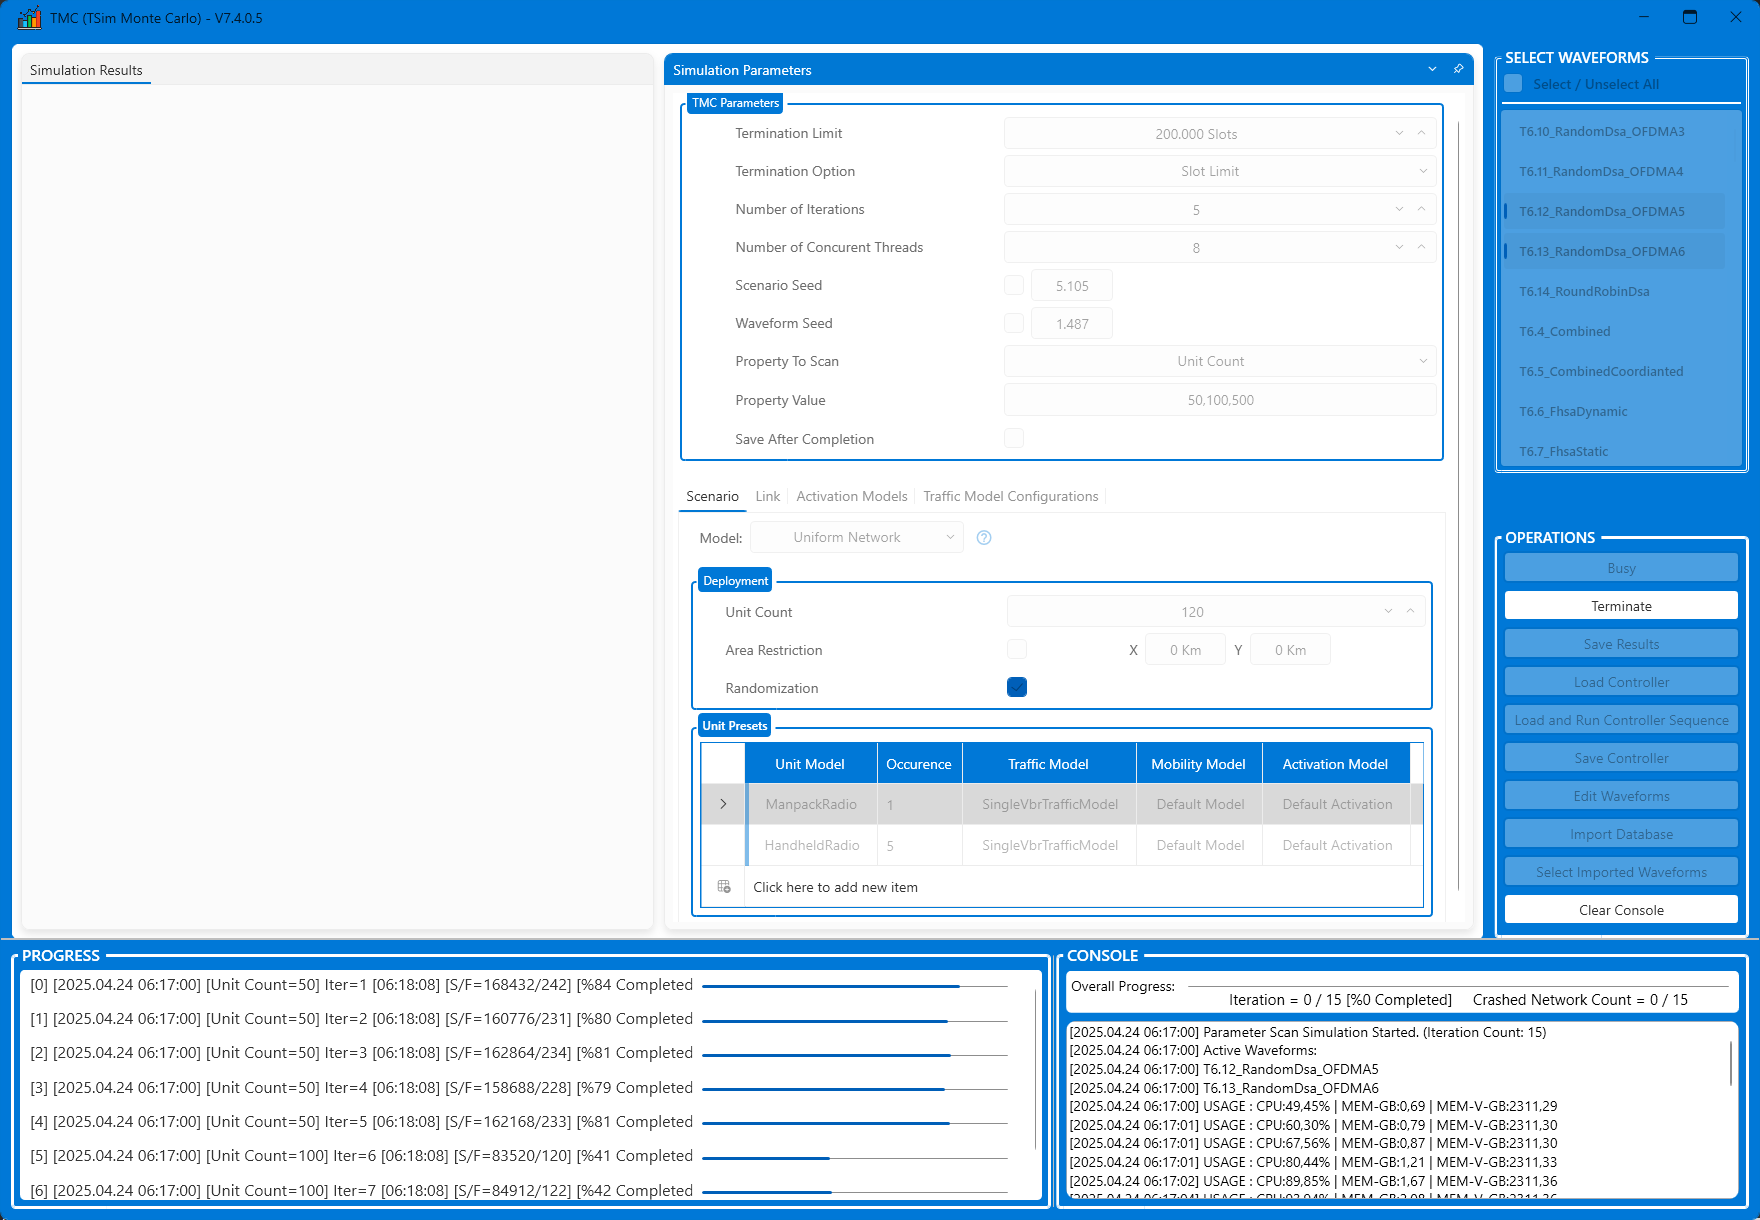
TMC Main Window
Graphs
After simulations are completed, the results for each metric can be viewed graphically within the TMC interface. Performance metrics for each simulated waveform are saved to a database. These stored metrics can later be reloaded and viewed again through TMC whenever needed.
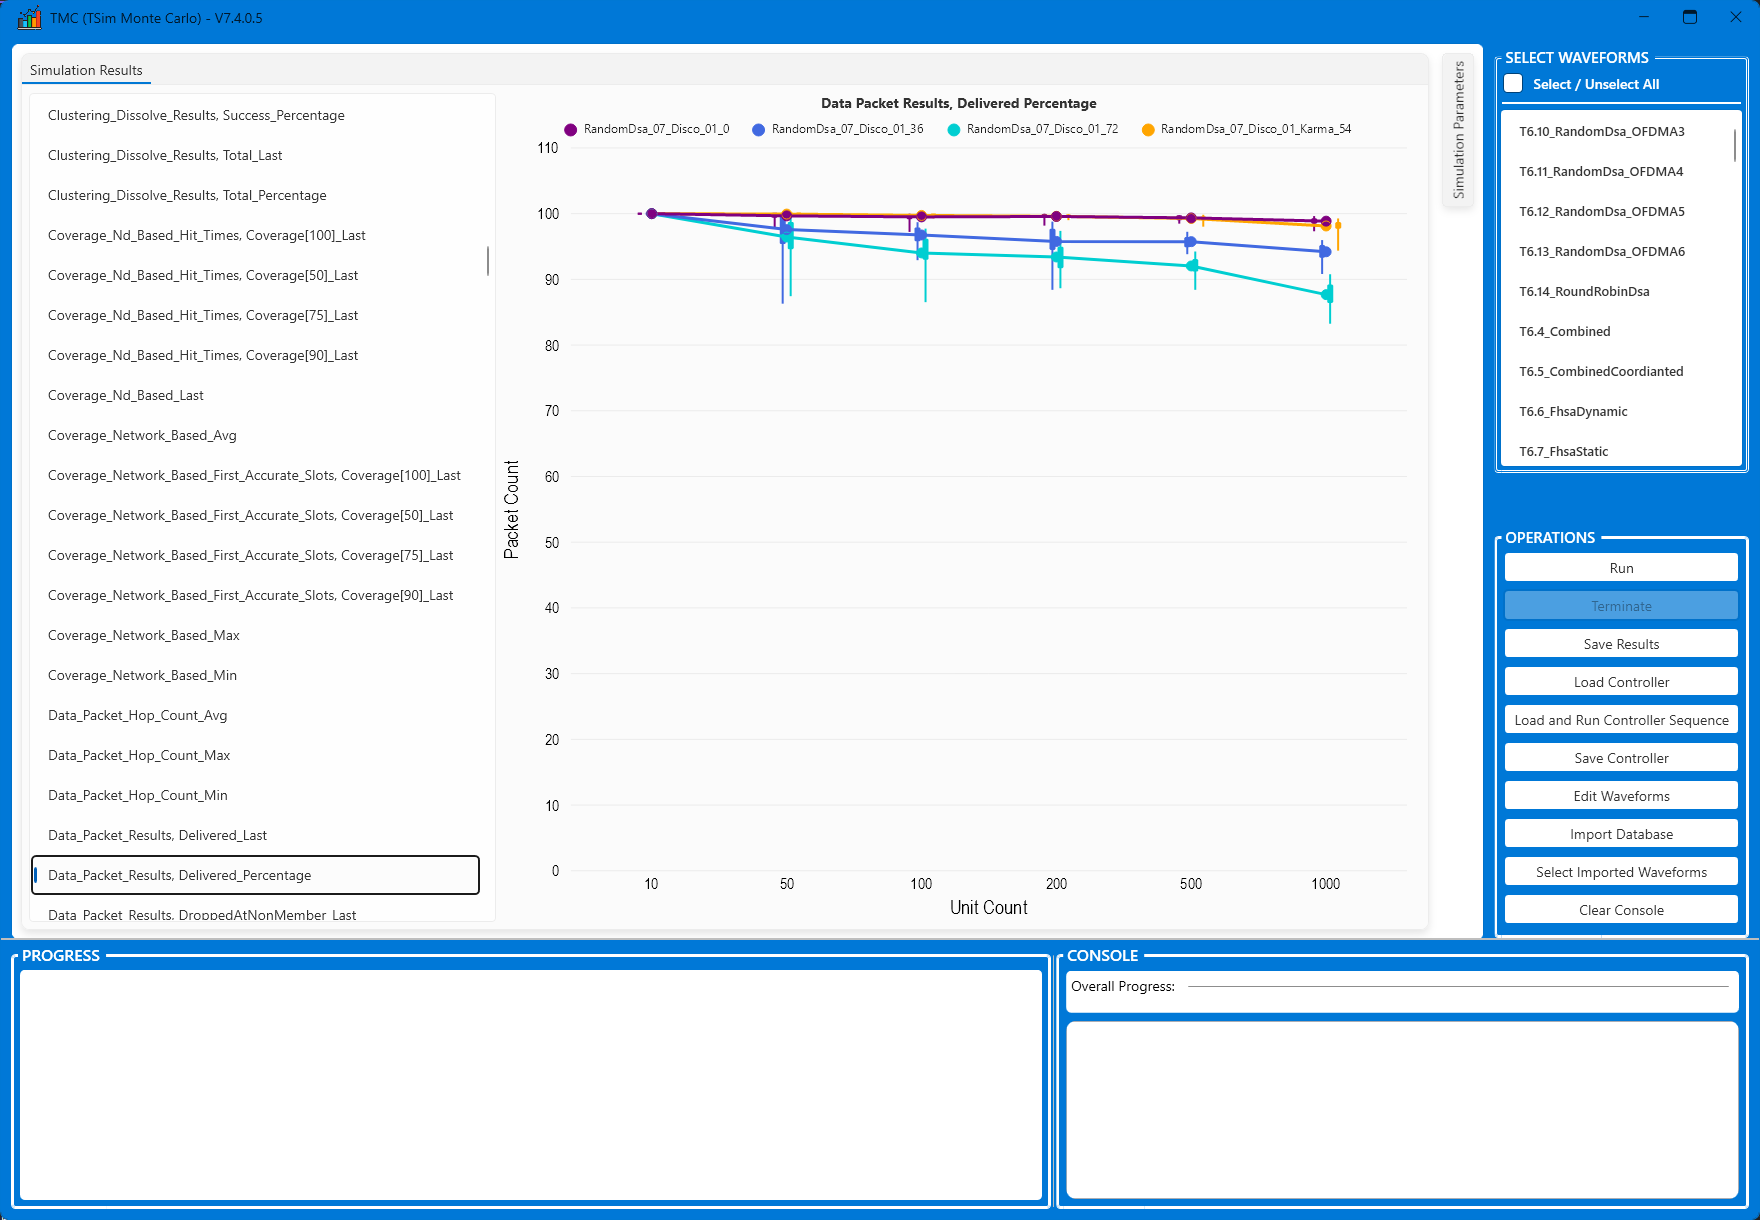
TMC Result Graphs
Histogram
When a specific point on the metric chart is clicked to examine its distribution, a metric histogram screen opens. This screen allows users to analyze the distribution of the data in more detail.
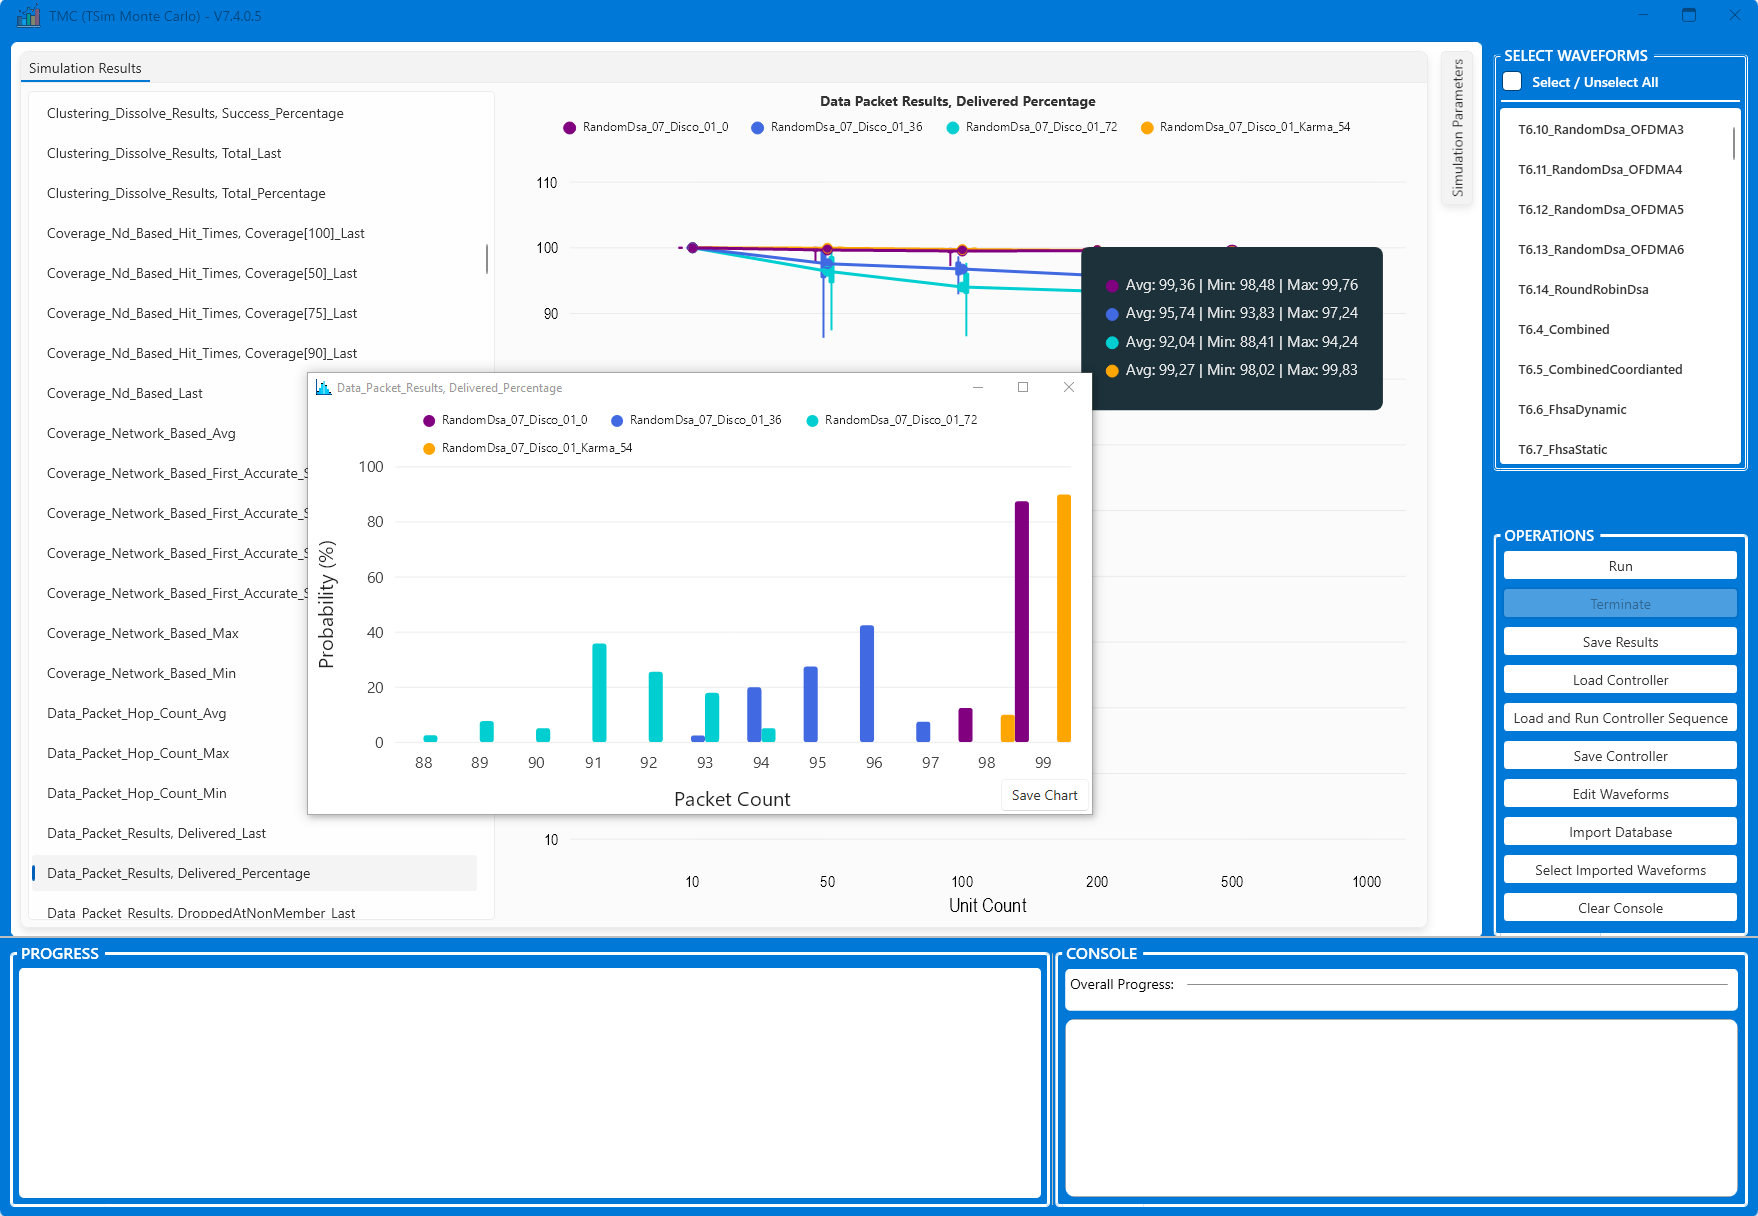
TMC Histogram Monitoring
Iteration Result Table
To enable more detailed analysis, the parameters and all resulting metric values of each simulation iteration can also be viewed in tabular format.
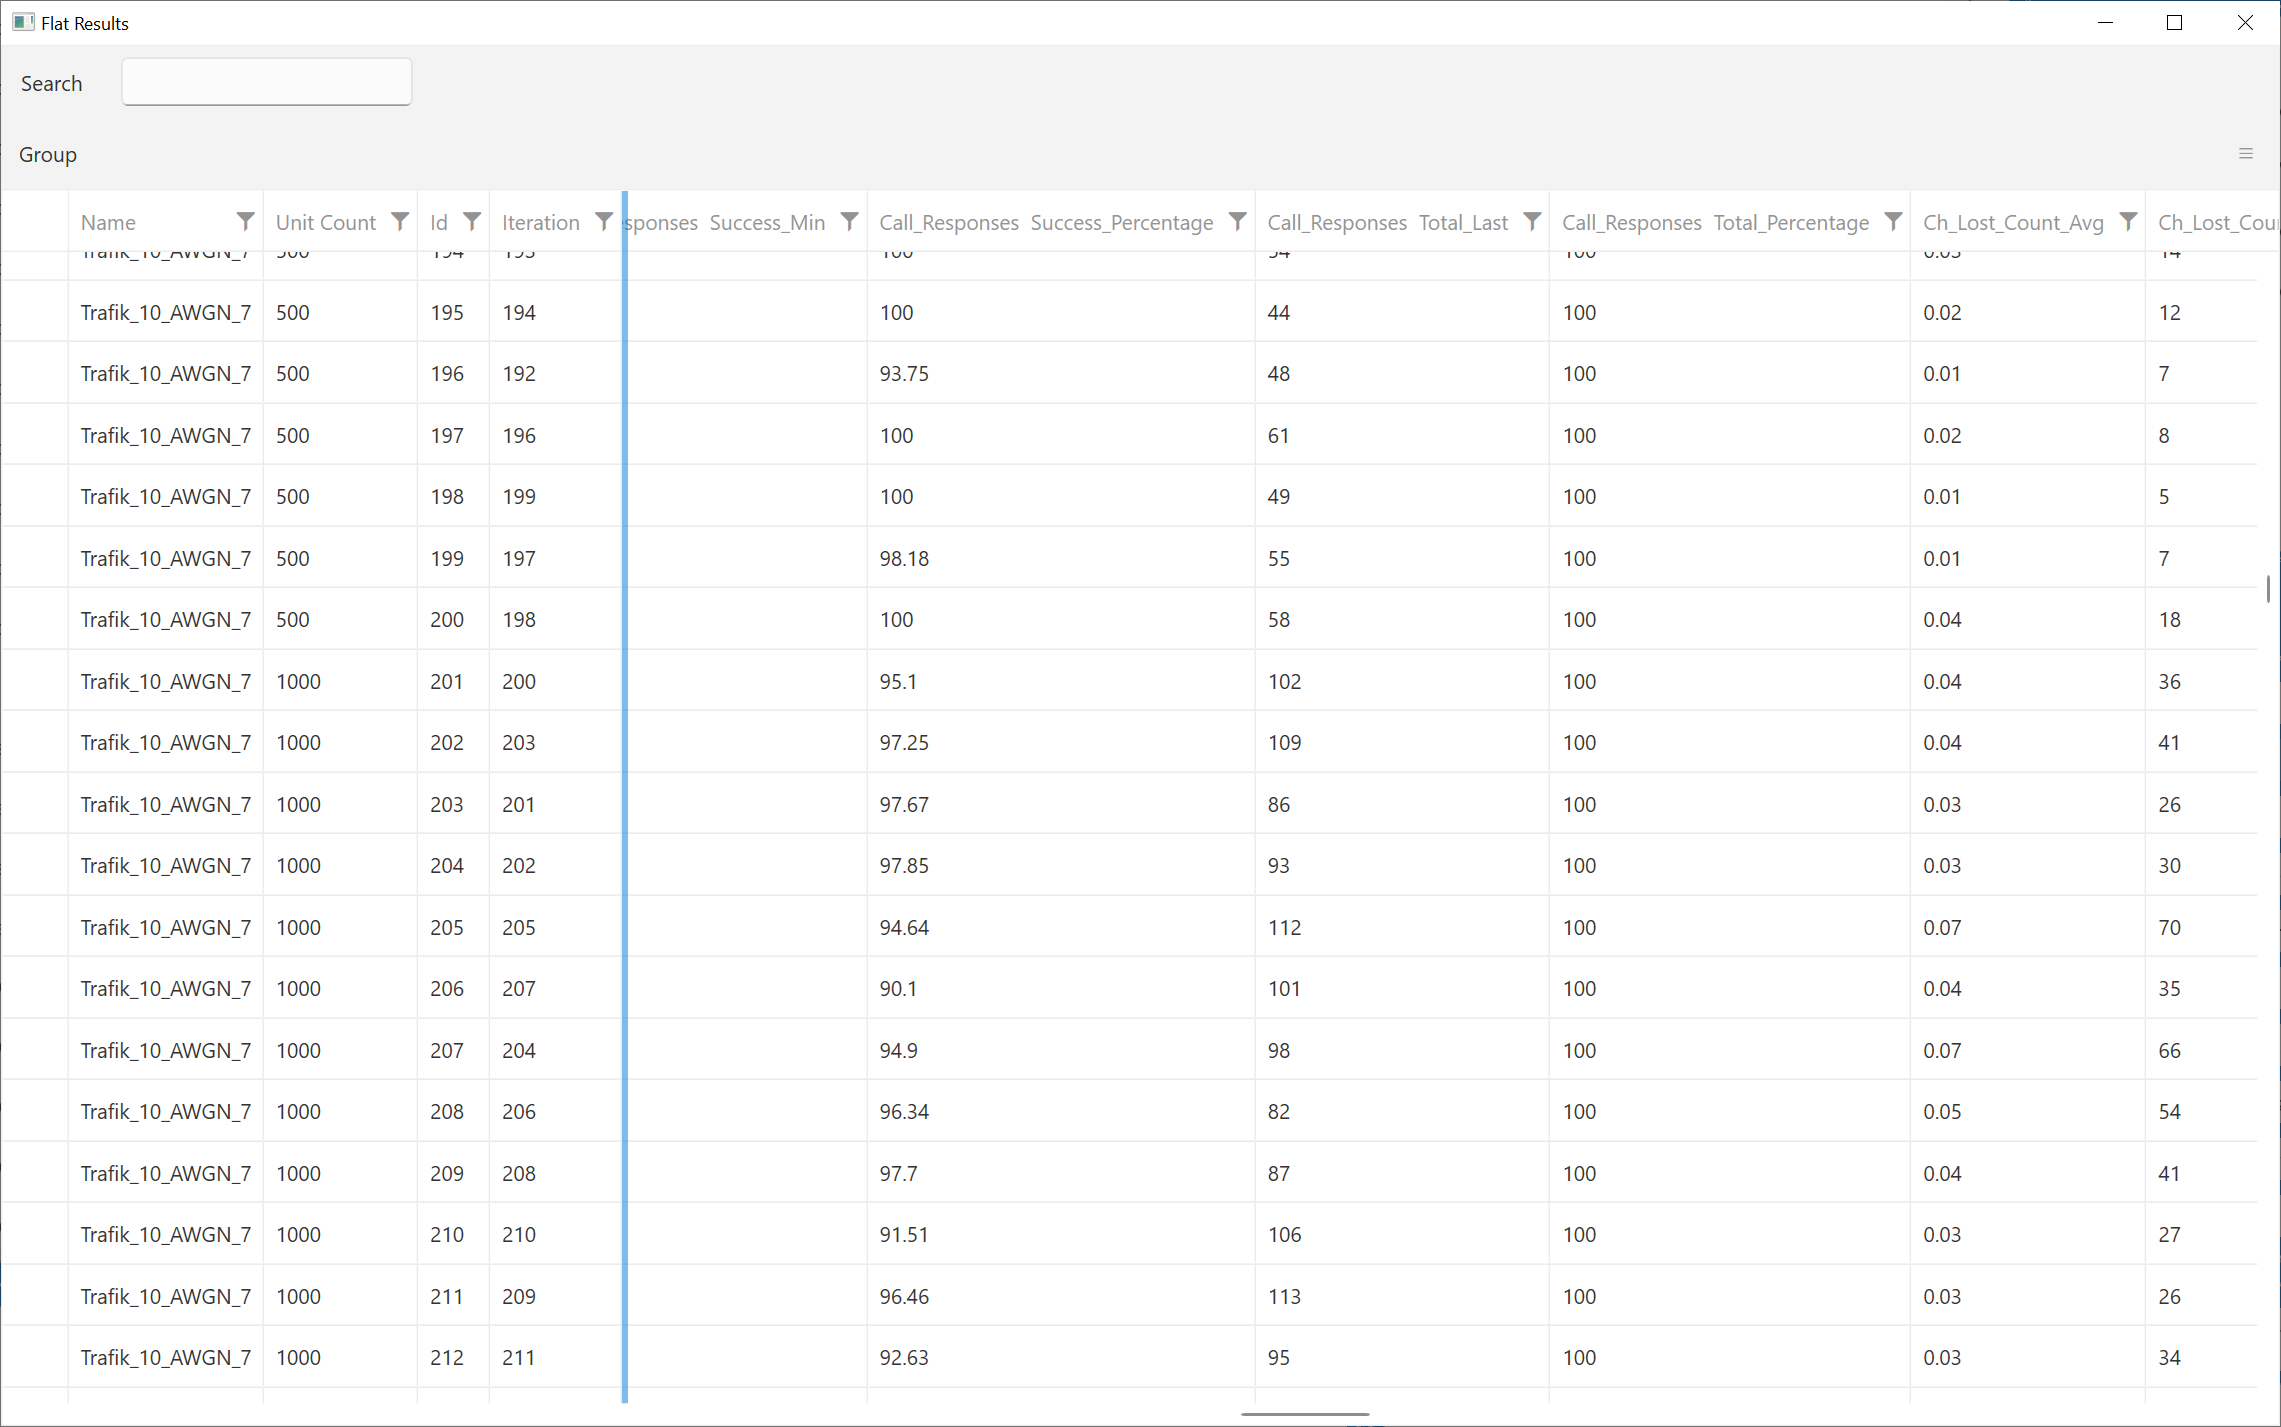
TMC Iteration- Result Table
Report
All graphs and metric descriptions displayed in the TMC interface, along with the simulation parameters, are saved as a PDF report. This allows simulation results to be quickly and easily shared.
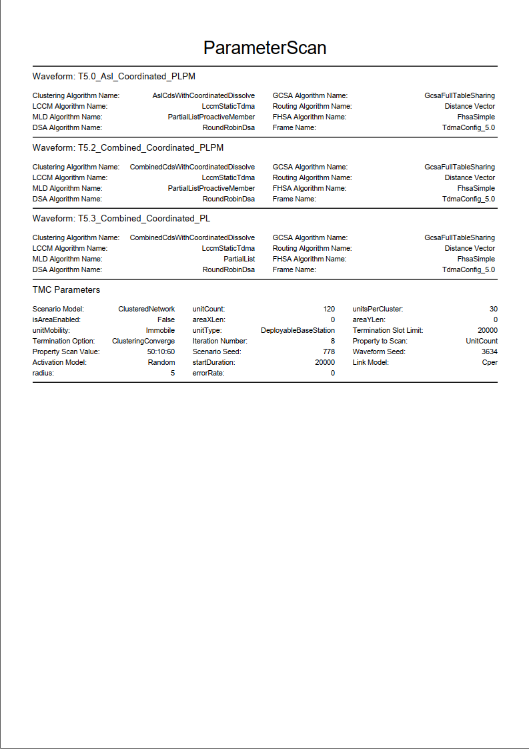
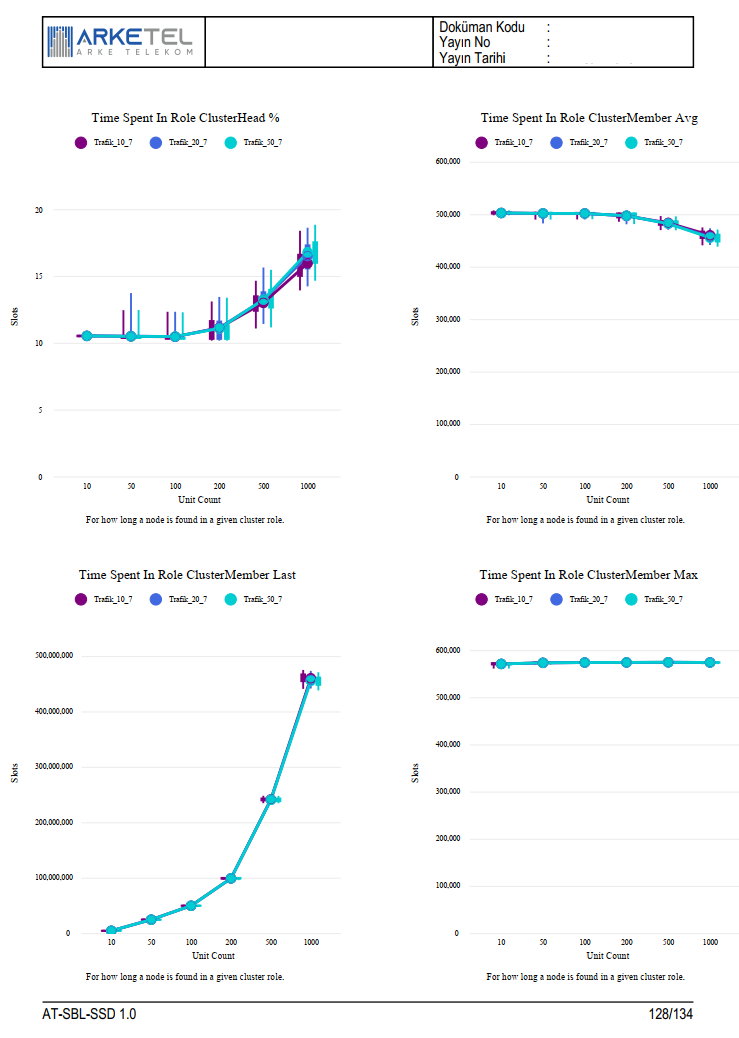
TMC PDF Report


